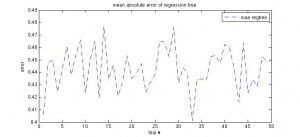
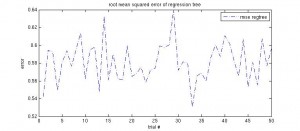
Another very simple idea to construct a model from data (with one continuous target variable) is that of using a regression tree. Matlab provides classregtree functions, aimed at constructing a regression tree. I ran it on my data with this script. The performance graphs are shown below, as well as an exemplary regression tree. There have been no optimisations so far, but the tree has been pruned to reduce its complexity for viewing.
Seiten
Kategorien
- agriculture
- conferences
- data mining
- Deutsch
- English
- Environmental Data Mining
- go8-coop
- ICDM 2008
- ICDM 2009
- ICDM 2010
- ICDM 2011
- ICPA 2010
- IDA 2009
- IDA 2010
- IEEE-ICDM10
- IFCS 2009
- IFIP AI-2008
- IPMU 2008
- IPMU 2010
- MLDM 2009
- neuroscience
- personal
- R
- SGAI AI-2007
- SGAI AI-2008
- SGAI AI-2009
- sports science
- Uncategorized
Our recent book
 Data Mining et al — RSS feed
Meta
Regression tree results
Update: MLP vs. SVM vs. RBF
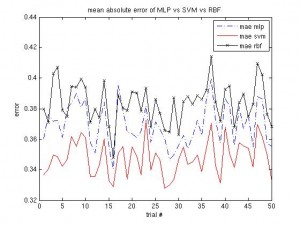
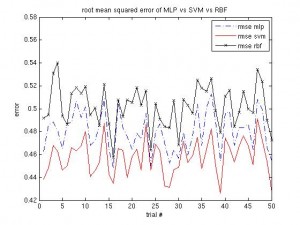
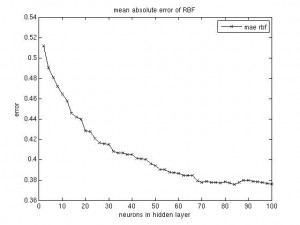
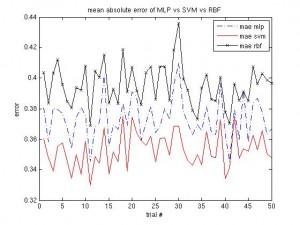
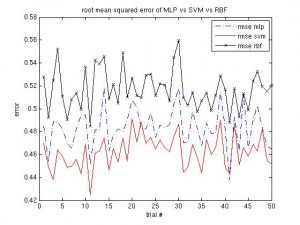
In the previous article on the MLP vs. SVM vs. RBF comparison the RBF performed worse than the other two. Well, even after doing some optimisation on the RBF parameters (hidden layer size), it is still continuously worse than SVM and MLP, although the margin is smaller.
RBF parameters
Since the size of the hidden layer of the RBF network seems to be the most important parameter, I’ve run a short simulation that outputs a graph for the network’s performance (mae, rmse), plotted against the hidden layer’s size. As expected, the curve turns out flat with larger numbers of neurons. A good tradeoff seems to fix the size at 70 neurons (for the given data set, of course).
(I could have plotted them into one figure, but I was too lazy to change the script.)
I’d like to mention that the cross validation partitioning step was done just once and the network’s parameter was varied just for this one data split. This might be a problem, but, as we saw in the previous post, the three models I’ve trained all perform similar, with similar ups and downs in performance over different data partitions. It therefore should be justified to run the RBF parameter experiment just on one split.
MLP vs. SVM vs. RBF
Yet another neural network, the radial basis function (RBF) network was used as a function approximation to compare against the MLP and SVM models. The parameter settings for the RBF have not been optimised so far. I simply ran it against the MLP/SVM on the same cross validation data. The results can be obtained from the following two graphics:
The script for the above graphics is online.
At the moment I’m running some simulations to determine the size of the hidden layer of the RBF network, as this seems to be the most important parameter. The matlab implementation of the RBF network also takes some time to incrementally add neurons up to a maximum number (user-specified).
SVM vs. MLP (reversed result, using normalization)
In the previous article I arrived at the result that the SVM performs slightly worse than the MLP neural network, each with more or less optimal configurations. Well, that was the preliminary result; I added normalization into the script and the outcome is the other way around. See the graphs below, the SVM is now consistently better than the MLP. I’ll have to check this result on other data sets, though.
Read the rest of this entry »
Preliminary model comparison: MLP vs. SVM
After figuring out some of the SVM parameters, I did a comparison of an MLP (feedforward neural network) technique vs. the SVM (support vector regression) technique for use as a predictor. The data were split into train/test set at a ratio of 9/1, both the SVM and the MLP were trained with those data and this was repeated a few (20) times. It turns out that the neural network seems to perform better and oscillates less over the trial runs. The following figures tell the tale more precisely:
Read the rest of this entry »
Figuring out SVM parameters
The last few days saw me experimenting with one particular data set and different parameters of the SVM regression model for those data. For the data set at hand, I figured epsilon, the width of the error pipe to be 0.3 and the standard deviation of the rbf kernel to be 12. Other kernels won’t work on those data and I’ll have to do a comparison of those results with the number of support vectors that are a further parameter that constitutes the models.
Read the rest of this entry »
SVM script updated for new Matlab version
The updated script that uses SVMTorch in regression mode uses the cvpartition function from the statistics toolbox in Matlab R2008a, which I happened to install today. Seems that my splitCV script is deprecated now.
Further info: I added a page on the left that provides easy access to some of the matlab scripts that I’ve created so far.
TR-Artikel online verfügbar
Der von mir verlinkte Artikel zum Precision Farming in der Technology Review ist inzwischen online verfügbar.
Testing SVMs on the agriculture data
Today I have started testing SVM regression models on the agriculture data that I’ve so far used for this year’s neural network publications. There are numerous implementations for SVM regression, some of which may be found at http://www.svms.org/software.html or http://www.support-vector-machines.org/SVM_soft.html.
Read the rest of this entry »
Data Mining et al is powered by WordPress | Using Tiga theme with a bit of Ozh + WP 2.2 / 2.3 Tiga Upgrade
