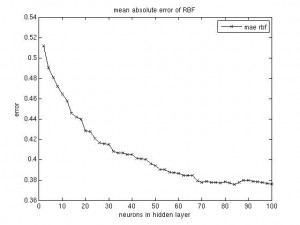
Since the size of the hidden layer of the RBF network seems to be the most important parameter, I’ve run a short simulation that outputs a graph for the network’s performance (mae, rmse), plotted against the hidden layer’s size. As expected, the curve turns out flat with larger numbers of neurons. A good tradeoff seems to fix the size at 70 neurons (for the given data set, of course).
(I could have plotted them into one figure, but I was too lazy to change the script.)
I’d like to mention that the cross validation partitioning step was done just once and the network’s parameter was varied just for this one data split. This might be a problem, but, as we saw in the previous post, the three models I’ve trained all perform similar, with similar ups and downs in performance over different data partitions. It therefore should be justified to run the RBF parameter experiment just on one split.


