As I mentioned some time ago, I got a paper accepted at the ICDM 2009 conference, held in Leipzig, Germany. I really liked this small type of conference last year and it was even better this year. The organisers had scheduled 32 presentations in three days, no parallel sessions and 25 minutes of talking time for every presenting author. At least from my point of view, this conference was very useful since it wasn’t that much about the theory of data mining or machine learning, but focused instead on the practical point of view. There were lots of industry people who just had their data problems and applied data mining to it. Theory is important, but practical applications are what makes the world go round. The invited talks by Claus Weihs and Andrea Ahlemeyer-Stubbe were really good examples of theory and practice. Claus Weihs could even remember that he had seen my data mining problem before, at the IFCS 2009 in Dresden, where there were a lot more presentations than at the ICDM.
Read the rest of this entry »
Seiten
Kategorien
- agriculture
- conferences
- data mining
- Deutsch
- English
- Environmental Data Mining
- go8-coop
- ICDM 2008
- ICDM 2009
- ICDM 2010
- ICDM 2011
- ICPA 2010
- IDA 2009
- IDA 2010
- IEEE-ICDM10
- IFCS 2009
- IFIP AI-2008
- IPMU 2008
- IPMU 2010
- MLDM 2009
- neuroscience
- personal
- R
- SGAI AI-2007
- SGAI AI-2008
- SGAI AI-2009
- sports science
- Uncategorized
Our recent book
 Data Mining et al — RSS feed
Meta
Report: ICDM 2009
ICDM2009 / MLDM2009
This week saw me busy preparing for next week’s two conferences ICDM2009 and MLDM2009, both taking place at the same location in Leipzig consecutively.
Read the rest of this entry »
ICDM/MLDM 2009, both accepted
Both my publications that I’ve handed in for the ICDM and MLDM conference have been accepted. The first one with two overall positive reviews, and the second one with just one review allowing it in for the poster session.
Apart from this, there’s not much to report, except that I’m currently converting (the scripts) to R for doing the computing stuff. Seems even more high-level and more abstract than matlab. And: it’s GNU and I can use vim for script editing and running.
A comparison of regression models — ICDM 2009 conference
I’ve just finished writing a paper which deals with the data sets I have for agricultural yield prediction. This will be handed in at the ICDM 2009 in Leipzig.
The abstract of the paper:
Nowadays, precision agriculture refers to the application of state-of-the-art GPS technology in connection with small-scale, sensor-based treatment of the crop. This introduces large amounts of data which are collected and stored for later usage. Making appropriate use of these data often leads to considerable gains in efficiency and therefore economic advantages. However, the amount of data poses a data mining problem — which should be solved using data mining techniques. One of the tasks that remains to be solved is yield prediction based on available data. From a data mining perspective, this can be formulated and treated as a multi-dimensional regression task. This paper deals with appropriate regression techniques and evaluates four different techniques on selected agriculture data. A recommendation for a certain technique is provided.
Extended Deadlines MLDM/ICDM
The deadlines for ICDM 2009 and MLDM 2009 have been mysteriously extended such that they coincide with the written examination for the course on Intelligent Systems, which I’m teaching this term. Nevertheless, the MLDM paper is almost finished whereas most of the work for the ICDM 2009 paper has been done, but has to be documented and ‚paperized‘ appropriately.
For the MLDM work, which is about applying Sammon’s mapping and Self-Organizing Maps to the agriculture data, there were some changes. For example, one of the data sets contains data for different fertilization strategies. This data set can also be split into two sub-data sets, one for each strategy, for in-depth analysis. One of the strategies was to use a neural network for yield prediction — and it has been unclear what kind of connections the NN has learnt so far. The idea is to visualize the data that the NN has used for training and prediction. So, projecting those data onto a mapping could yield interesting results as to the internal workings of the NN. This is more or less what the paper is about. Useful, interesting, and encouraging.
Without further commenting, here are some graphs:
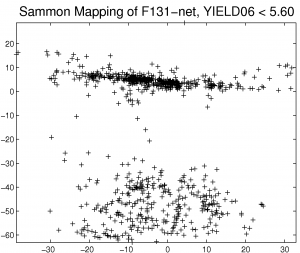
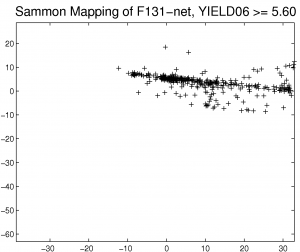
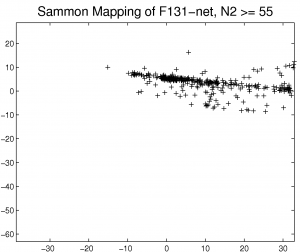
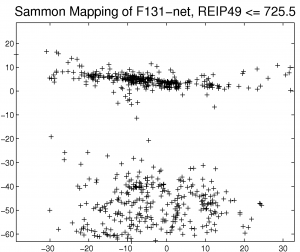
I do see correlations. What about you?
Four models to be compared [update]
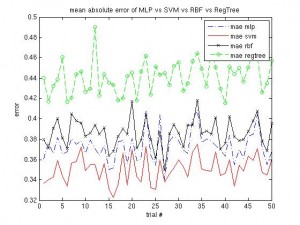
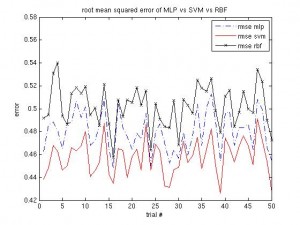
Same procedure as in recent posts … I have four models to be compared, I’ve put them into this script (which runs about an hour on my machine) and the results can be seen below. The simple regression tree is the worst model, but takes almost no time to compute. The RBF takes longest, but the SVM is still better and quicker. I’ll probably run this script on different data, to see how it performs there.
Regression tree results
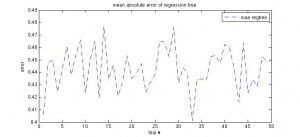
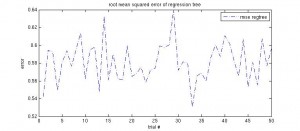
Another very simple idea to construct a model from data (with one continuous target variable) is that of using a regression tree. Matlab provides classregtree functions, aimed at constructing a regression tree. I ran it on my data with this script. The performance graphs are shown below, as well as an exemplary regression tree. There have been no optimisations so far, but the tree has been pruned to reduce its complexity for viewing.
Update: MLP vs. SVM vs. RBF
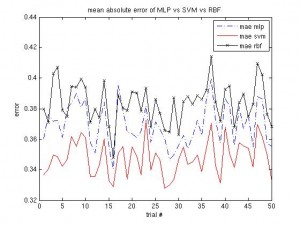
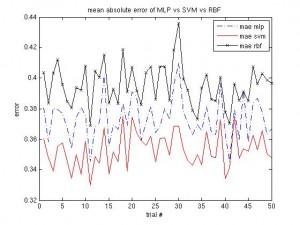
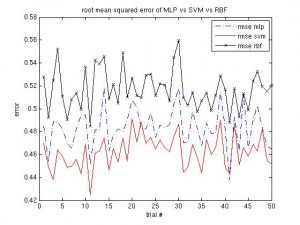
In the previous article on the MLP vs. SVM vs. RBF comparison the RBF performed worse than the other two. Well, even after doing some optimisation on the RBF parameters (hidden layer size), it is still continuously worse than SVM and MLP, although the margin is smaller.
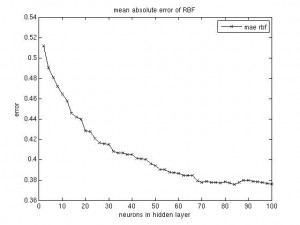
RBF parameters
Since the size of the hidden layer of the RBF network seems to be the most important parameter, I’ve run a short simulation that outputs a graph for the network’s performance (mae, rmse), plotted against the hidden layer’s size. As expected, the curve turns out flat with larger numbers of neurons. A good tradeoff seems to fix the size at 70 neurons (for the given data set, of course).
(I could have plotted them into one figure, but I was too lazy to change the script.)
I’d like to mention that the cross validation partitioning step was done just once and the network’s parameter was varied just for this one data split. This might be a problem, but, as we saw in the previous post, the three models I’ve trained all perform similar, with similar ups and downs in performance over different data partitions. It therefore should be justified to run the RBF parameter experiment just on one split.
MLP vs. SVM vs. RBF
Yet another neural network, the radial basis function (RBF) network was used as a function approximation to compare against the MLP and SVM models. The parameter settings for the RBF have not been optimised so far. I simply ran it against the MLP/SVM on the same cross validation data. The results can be obtained from the following two graphics:
The script for the above graphics is online.
At the moment I’m running some simulations to determine the size of the hidden layer of the RBF network, as this seems to be the most important parameter. The matlab implementation of the RBF network also takes some time to incrementally add neurons up to a maximum number (user-specified).
Data Mining et al is powered by WordPress | Using Tiga theme with a bit of Ozh + WP 2.2 / 2.3 Tiga Upgrade
