Georg Ruß' PhD Blog — R, clustering, regression, all on spatial data, hence it's:

Mai 30th, 2008

SOM further ideas

At the moment we’re in the final stage of preparing one paper that presents our SOM research from recent months on the agriculture data. Future ideas will probably (at least in part) result from exploiting the SOM toolbox further. Some hints as to what’s possible can be found in the gallery.

Mai 28th, 2008

Matlab and colormap

For the SGAI-2008 conference paper it is required that the figures are in black-and-white. I can’t just convert the color figures into b/w because the color maps are wrecked and dark parts in SOMs that were clearly distinguishable before are the same shade of black after the conversion. The som_show function in the SOM toolbox has a colormap parameter. As it turned out, as usual, there’s just one more thing to do to generate the figures in a gray-scale colormap, using Matlab’s colormap function:

som_show(sM, [... more parameters ...],'colormap',colormap(gray))

Read the rest of this entry »

Mai 26th, 2008

Matlab and savefig

When generating some figures for a paper, I was looking for an easy way to save figures the way I wanted them. There are some limitations within Matlab’s built-in functions for that. My solution is to use the savefig script by Peder Axensten, which is available from the Mathworks‘ site at Matlab Central. It may save some time for you, too. Peder also has authored further (probably useful) scripts.

Mai 23rd, 2008

Using the SOM toolbox with agricultural yield data

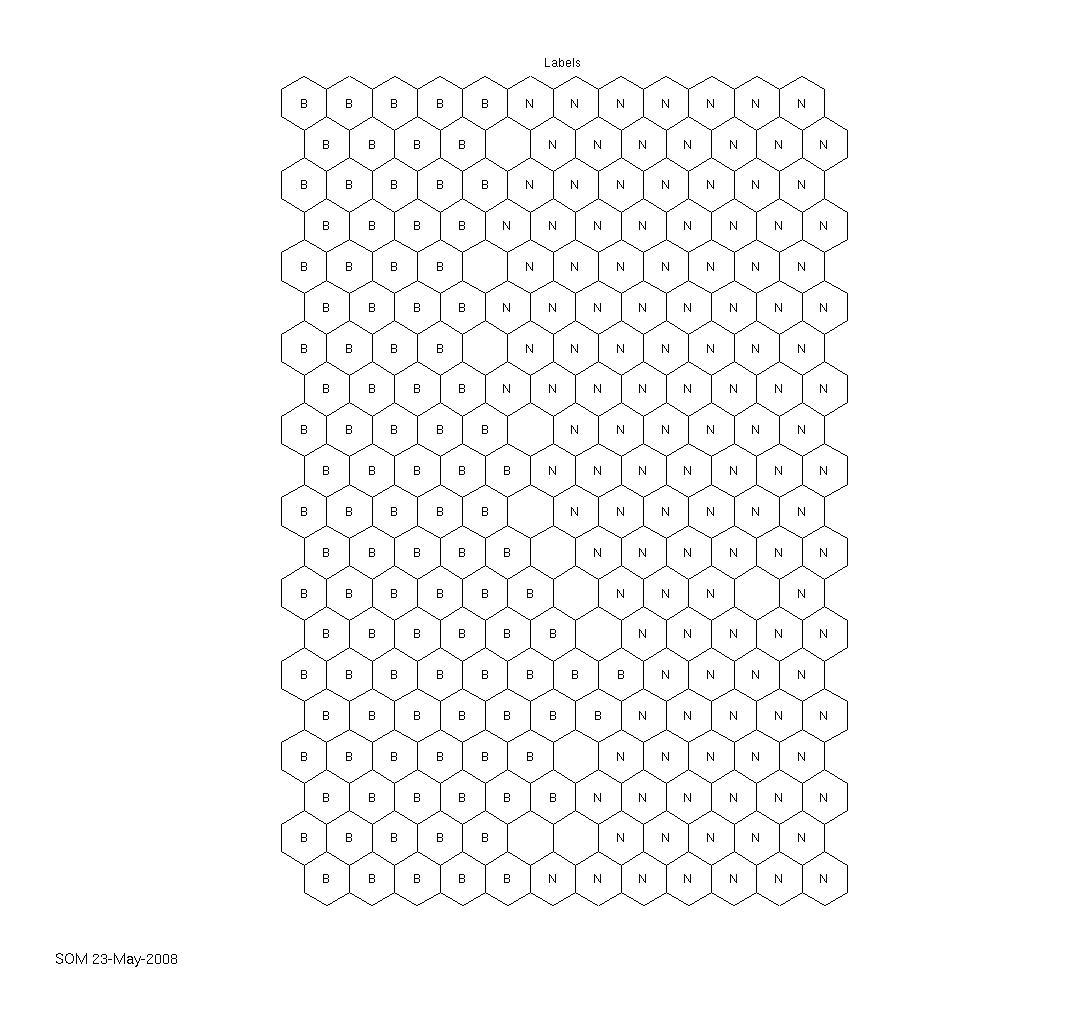
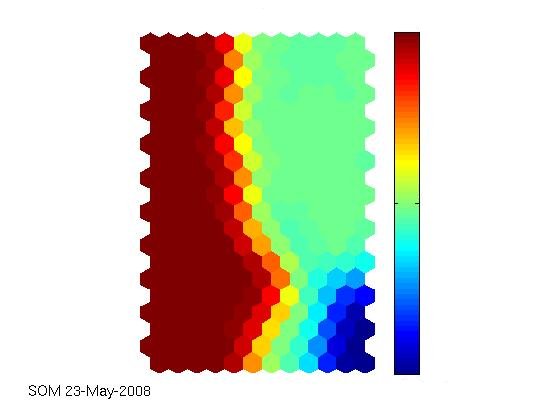
The technical report that I linked to in the latest article is really comprehensive. Together with the supplied iris dataset (that can, of course, also be obtained elsewhere), the SOM toolbox works well and out-of-the-box, as expected. Seems as if the agricultural yield data we have are really interesting and can be visualised appealingly. The first labeled map shows the clustering capability of the SOM. There have been two fertilization strategies on the field where the data come from, simply named „B“ and „N“ here. The second map shows how much fertilizer has been used on the field, from low (blue) to high (red) values. The correlation between the labels and the colored map is obvious. Nevertheless, the ultimate goal still is to try to outperform a neural network in predicting the current year’s yield from sensor data and historical data and, along the way, identify indicators of a field’s heterogeneity.
Self-Organizing Map, clustering the agricultural yield dataSelf-Organizing Map, one of the fertilizer maps
Read the rest of this entry »

Mai 16th, 2008

Vesanto’s SOM toolbox for Matlab

It turned out that Vesanto’s SOM toolbox for Matlab is very well written and works right out-of-the-(tool)box. It’s advisable to read the documentation and the technical report (.pdf). And it’s really worthwile to try one of the matlab examples which is some kind of tutorial on how to work with the SOMs.
Read the rest of this entry »

Mai 14th, 2008

Präziser Ackerbau erreicht die F.A.Z.

Inzwischen erreicht das Thema Precision Farming (oder Präziser Ackerbau bzw. Teilflächenspezifische Bewirtschaftung) auch die Massenmedien. In der Frankfurter Allgemeinen Zeitung vom 10.05.2008 ist auf Seite 20 ein Artikel mit der Überschrift Mit GPS in die Ackerfurche erschienen. Die vor allem wirtschaftlichen Vorteile von PF beim Pflügen, Düngen und bei der Aussaat werden klar herausgestellt. Auch die Möglichkeiten von Satellitenfotos werden erwähnt und die damit zu erzielenden teilweise beträchtlichen Kosteneinsparungen sind nicht zu verachten.

Hinzugefügt am 19.05.2008 Ähnlicher Artikel, etwas emotionaler, in der Wirtschaftswoche.

Mai 8th, 2008

Preparing another paper for SGAI AI-2008

I feel as if I had just returned from AI-2007 (at least the expenses were paid just recently by the University) and there’s the deadline approaching for AI-2008, again held at Peterhouse College, UK.
Read the rest of this entry »

|