I gave my talk on last week’s IFCS/GfKl conference in Dresden, sticking to the 15 minutes that had been set for speakers, with an additional five minutes for discussion. However, unbeknownst to me, Alexander Brenning attended that particular session. He had been working in the final stages of the preagro collaborative research project where my co-authors had also been involved. Hence, he knew exactly what I was talking about, knew the data and where they came from and could therefore raise two important issues:
Read the rest of this entry »
Seiten
Kategorien
- agriculture
- conferences
- data mining
- Deutsch
- English
- Environmental Data Mining
- go8-coop
- ICDM 2008
- ICDM 2009
- ICDM 2010
- ICDM 2011
- ICPA 2010
- IDA 2009
- IDA 2010
- IEEE-ICDM10
- IFCS 2009
- IFIP AI-2008
- IPMU 2008
- IPMU 2010
- MLDM 2009
- neuroscience
- personal
- R
- SGAI AI-2007
- SGAI AI-2008
- SGAI AI-2009
- sports science
- Uncategorized
Our recent book
 Data Mining et al — RSS feed
Meta
Two emerging issues
Updated slides for IFCS2009
Here are my updated slides for IFCS 2009, which I’m currently participating in: slides-russ2009ifcs.pdf
So far, there have been a lot of interesting talks and I got some new visualization ideas. In particular, Michael Greenacre had some interesting videos with morphing data points and nice visualizations to show. Earlier on in this blog, I already had this idea to visualize data (or projections of those) to find split values. So there might be some interesting things in this direction.
Submission for IDA 2009, Lyon
At the moment, I’m (in parallel) preparing slides for this week’s IFCS talk and working on an upcoming publication for IDA 2009. I will extend the work on the regression models with ideas on how to identify useful heterogeneity sensors. Some of those ideas will already be presented at this week’s talk at the IFCS. An evaluation is to follow due course.
Yet another talk of mine at a conference
I spent the past five weeks thinking about how I am to proceed in my research. I’m not quite done yet with shuffling and re-structuring thoughts and ideas but I’ll be getting there sooner or later.
Anyway, there’s a talk of mine at next week’s IFCS conference in Dresden, Germany. My talk is scheduled for Sunday, March 15th, in the afternoon. I’ll present the regression model comparison shown earlier in this blog and some ideas on how to evaluate whether a sensor is useful or not for the purpose of yield prediction. I assume that the conference is going to yield some more ideas on the latter question.
My slides, as of now, are here: slides-russ2009ifcs.pdf
A comparison of regression models — ICDM 2009 conference
I’ve just finished writing a paper which deals with the data sets I have for agricultural yield prediction. This will be handed in at the ICDM 2009 in Leipzig.
The abstract of the paper:
Nowadays, precision agriculture refers to the application of state-of-the-art GPS technology in connection with small-scale, sensor-based treatment of the crop. This introduces large amounts of data which are collected and stored for later usage. Making appropriate use of these data often leads to considerable gains in efficiency and therefore economic advantages. However, the amount of data poses a data mining problem — which should be solved using data mining techniques. One of the tasks that remains to be solved is yield prediction based on available data. From a data mining perspective, this can be formulated and treated as a multi-dimensional regression task. This paper deals with appropriate regression techniques and evaluates four different techniques on selected agriculture data. A recommendation for a certain technique is provided.
Extended Deadlines MLDM/ICDM
The deadlines for ICDM 2009 and MLDM 2009 have been mysteriously extended such that they coincide with the written examination for the course on Intelligent Systems, which I’m teaching this term. Nevertheless, the MLDM paper is almost finished whereas most of the work for the ICDM 2009 paper has been done, but has to be documented and ‚paperized‘ appropriately.
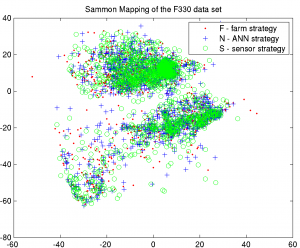
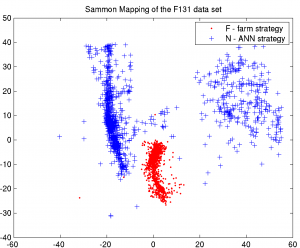
For the MLDM work, which is about applying Sammon’s mapping and Self-Organizing Maps to the agriculture data, there were some changes. For example, one of the data sets contains data for different fertilization strategies. This data set can also be split into two sub-data sets, one for each strategy, for in-depth analysis. One of the strategies was to use a neural network for yield prediction — and it has been unclear what kind of connections the NN has learnt so far. The idea is to visualize the data that the NN has used for training and prediction. So, projecting those data onto a mapping could yield interesting results as to the internal workings of the NN. This is more or less what the paper is about. Useful, interesting, and encouraging.
Without further commenting, here are some graphs:
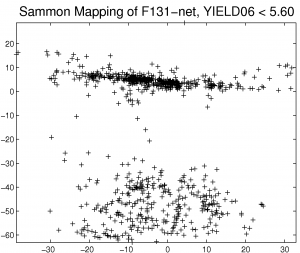
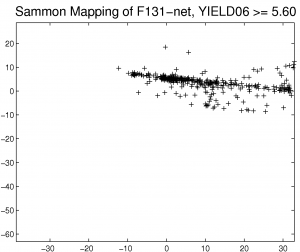
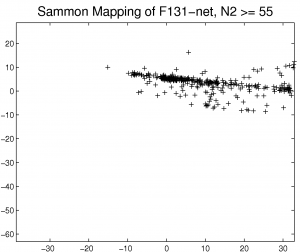
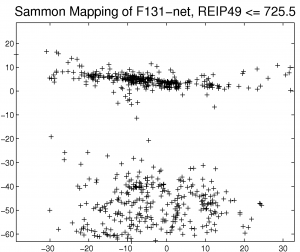
I do see correlations. What about you?
Sammon’s mapping for visualization
While everyone else is at home, I rode to work and implemented Sammon’s mapping on two of the agriculture data sets. The data set descriptions are in the paper I presented at the SGAI. One of the sets has three farming strategies, the other one just two. I decided to apply the dimensionality reduction of Sammon’s mapping and it turns out that it works quite well for both of the data sets, although the interpretation is much easier for the second one. For starters, here are the plots:
Report of participation at SGAI 2008
From 10th to 11th of December, 2008, I participated in the Twenty-eighth SGAI International Conference on Artificial Intelligence. My talk was on the usage of self-organizing maps for data mining, using the agriculture data as a basis. I didn’t really get any important feedback right after my talk but I could talk to some of the academics who all said that my topic is very relevant and worth working on. Regarding my PhD, the main concern I’ll have to take into account is that it is not supposed to be a PhD in agriculture, but in computer science, so I can’t get away with just applying some data mining techniques to some agriculture data. But my ideas are still there and my thesis structure has also emerged.
For reference reasons, my slides for last week’s conference: slides-2008sgai.
Four models to be compared [update]
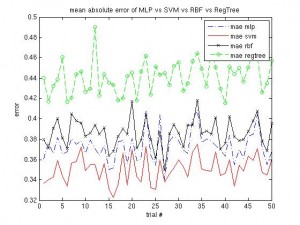
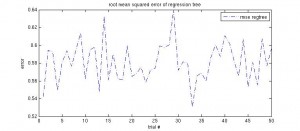
Same procedure as in recent posts … I have four models to be compared, I’ve put them into this script (which runs about an hour on my machine) and the results can be seen below. The simple regression tree is the worst model, but takes almost no time to compute. The RBF takes longest, but the SVM is still better and quicker. I’ll probably run this script on different data, to see how it performs there.
Regression tree results
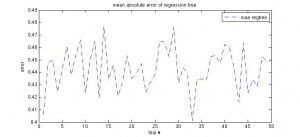
Another very simple idea to construct a model from data (with one continuous target variable) is that of using a regression tree. Matlab provides classregtree functions, aimed at constructing a regression tree. I ran it on my data with this script. The performance graphs are shown below, as well as an exemplary regression tree. There have been no optimisations so far, but the tree has been pruned to reduce its complexity for viewing.
Data Mining et al is powered by WordPress | Using Tiga theme with a bit of Ozh + WP 2.2 / 2.3 Tiga Upgrade
