Georg Ruß' PhD Blog — R, clustering, regression, all on spatial data, hence it's:

November 2nd, 2007

Regression analysis with postreg and 3D-plots

There’s ever more Matlab functions to be discovered, as I mentioned lately. I took the time and finished reading the „Neural Network Toolbox 5 User’s Guide“. At the moment I can’t use most of the divide* functions as I’m using an older Matlab release. Something that works is postreg which can be used to perform a regression analysis between the network response and the corresponding targets. Since I assume that it might be useful to study the impact of two network parameters on the model, I decided to vary the learning rate and the hidden layer size of the neural network. This makes for nice 3D plots:
agri08_postreg_train.jpgagri08_postreg_test.jpgagri08_postreg_train_test.jpg
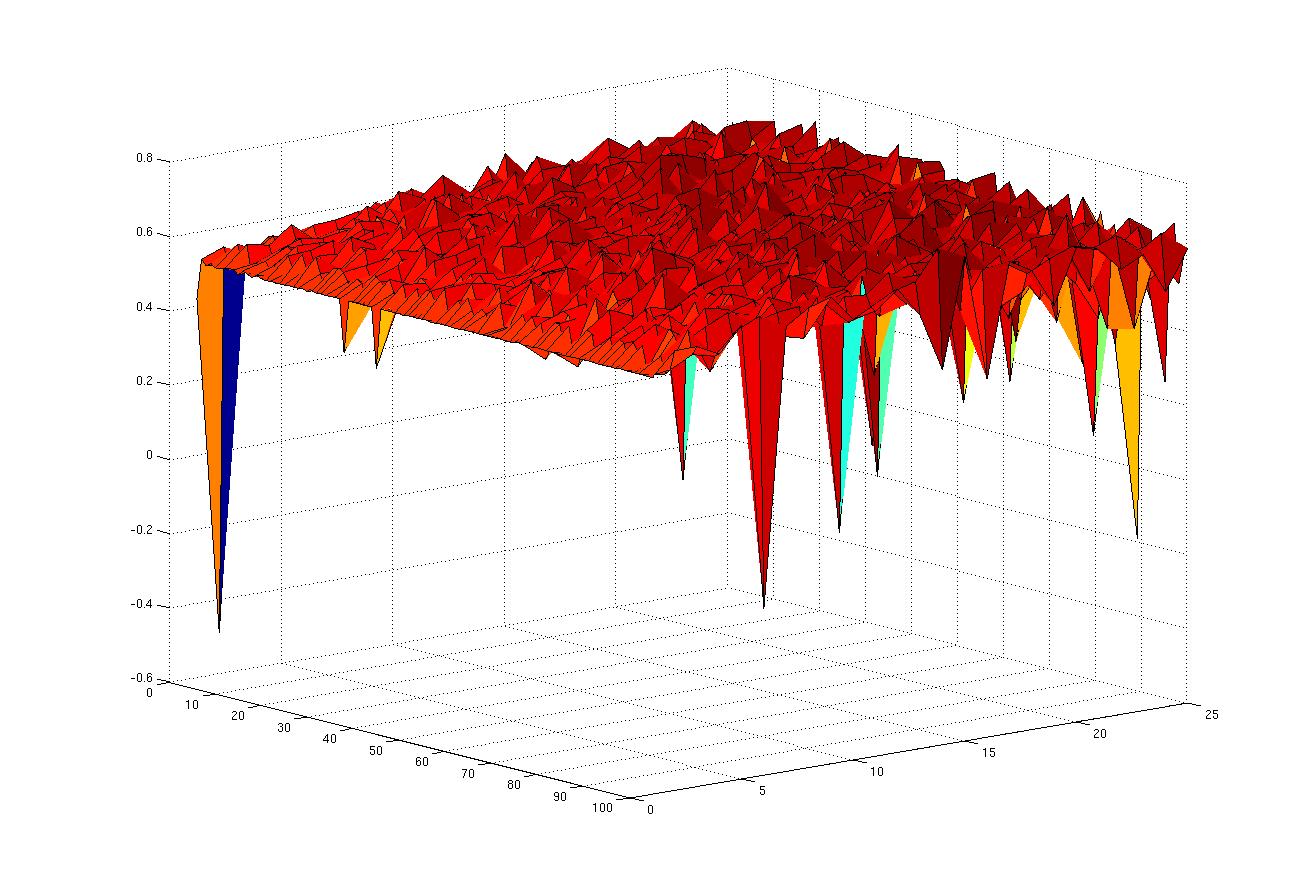
Both show the value of the correlation coefficient between the simulated output and the actual target. The first one does this for the training set, whereas the second one does this for the validation data (that was not included in training). The third plot combines both, although it’s hard to find an appropriate viewing angle. The hidden layer size was varied from 1 to 25, and the min_grad parameter was varied from 0.1/1 to 0.1/100 (hence the 1-100 scale).

The network works as expected:

  • with more available weights (growing hidden layer), the approximation gets better
  • with a smaller gradient (i.e. longer learning time) the approximation gets better

The script can be found here: agricult_08.m.

Oktober 30th, 2007

Highly recommended: Matlab’s nnet manual

Diving deeper into Matlab’s endless built-in functions, I discovered (i.e. read) Mathworks‘ nnet manual. I usually abhor user manuals for specific programming languages, but Mathworks has made it an enjoyable read.
Read the rest of this entry »

Oktober 26th, 2007

Cross validation — how to determine fold size

When applying cross validation, it is necessary to determine an appropriate size for folds of data to split the data set accordingly. An empirical way to do this is to try different fold sizes and check when the error reaches a minimum (or some other criterion). This is what the latest matlab script does.
Read the rest of this entry »

Oktober 23rd, 2007

Underestimating Matlab’s built-in functions

To clean up the main code of the cross-validation script, I decided to source out the part that deals with splitting the data into training and testing sets. After I had created and verified the code, I discovered Matlab’s built-in dividevec function from the Neural Network Toolbox. It does something similar and was introduced from R2006A:

The dividevec function facilitates dividing your data into three distinct sets to be used for training, cross validation, and testing, respectively. Previously, you had to split the data manually.

Read the rest of this entry »

Oktober 18th, 2007

Using Matlab’s rand() function to determine network parameters

In the recent scripts I used Matlab’s rand() function to seed the random number generator. I aimed at generating reproducible results. However, if the data can be modeled with an MLP, then it should most of the time converge towards the same solution, given that the initialization is not too different (weights from -1 to 1).
Read the rest of this entry »

Oktober 17th, 2007

Experiments with the agriculture data (II)

Yesterday’s entry featured a short cross validation, using a fixed network structure. This structure should be verified and improved.
Read the rest of this entry »

Oktober 16th, 2007

Experiments with the agriculture data (I)

Just to get an impression of the nature of the data, I slightly edited the matlab script that I used with the sports science data and applied it.
Read the rest of this entry »

Oktober 10th, 2007

Details on the agriculture data (II)

Since the term precision farming is not as new as one might expect (see, e.g., the links at the end of the Wikipedia article on precision farming), the data I am working on has already been collected using methods of precision farming. There was one trial in 2003 for data collection and another one in 2004 for verification.

The collected attributes and amount of data are as mentioned in the last post. The farming variants that determine the amount of fertilizer are as follows:

  • human decision, based on personal experience of farmer, without in-field variability (13% of data)
  • human decision with smaller management zones (mapping, 30%)
  • sensor decision, based on on-line sensor input from the field, uses decision rules that have been mined off-line (30%)
  • nitrogen variation: progression of fertilizer amount to collect data (13%)
  • no specific variant (14%)

Next will be a plan on how to construct MLPs from these data and test them. There might be some delay due to my teaching obligations in this year’s winter term.

Oktober 4th, 2007

Details on the agriculture data (I)

The data set that has been kindly provided by Martin Schneider was obtained from growing of winter wheat.
It has roughly 5000 records for small-scale areas of a crop field, which contain the following attributes:

  • ID: numeric identifier
  • N1, N2, N3: there are three periods (at least in Germany) where fertilizer is applied; these values store the amount used per area
  • REIP32, REIP49: indexed value that measures the amount of sunlight reflected from the crop
  • EM38: electric conductivity of soil
  • Variant: categorical attribute, describes the management strategy applied to the area under consideration
  • tractive power: the amount of power that is needed to pull e.g. a plough
  • yield 2003, 2004: stores the yield from the respective area

The target is quite similar to the one in the sports science category:

  • learn neural networks from the data
  • feed the networks with current year’s input data
  • predict this year’s yield and / or
  • optimize the amount of fertilizer by simulating different amounts and predicting with the ANNs
September 12th, 2007

Optimization using agricultural data

A friend of mine works at the Martin-Luther-Universität Halle-Wittenberg in the agriculture department and he’s interested in using neural networks for yield optimization and/or forecasting. The project has much to do with precision farming, i.e., using modern differential GPS and sensor technology to automate and optimize fertilizer usage. It works as follows:

  • In one year, the amount of fertilizer used and the yield are measured and the data is stored. This is done on small-scale areas, hence the term precision farming.
  • Miscellaneous data from various sensors are obtained and stored with the yield data.
  • A neural network (or other forecasting methods) or decision trees can be learned from the data.
  • In subsequent years, using currently measured sensor input, the amount of fertilizer can be adjusted precisely to optimize, environmentally or economically.

The project could be developed towards a full-scale, all-inclusive solution for farmers:

  1. A contract between the data mining company (DMC) and the farmer is agreed upon.
  2. The DMC supplies (lends) sensory equipment to the farmers.
  3. The farmers fertilize and harvest the crop as usual, thereby harvesting data as well.
  4. The DMC acquires the data and mines them.
  5. In subsequent years, the farmer can obtain optimized fertilization data from the DMC. He can use it to reduce fertilizer usage or to optimize otherwise.

The ideas are based on work by Georg Weigert N-Düngung bei Winterweizen mit Entscheidungsbäumen (or his dissertation) and Martin Schneider.