
Just to get an impression of the nature of the data, I slightly edited the matlab script that I used with the sports science data and applied it.
It does still perform cross validation. I used the script from this site to plot data from files with column headings. It’s just a convenience thing to keep the header inside the file to keep track of changes I’ve made in the data.
As described in the last post, the data is split up into five blocks. I used the block that contains no specific variant and did leave-one-out cross validation. Since the number of records is larger than in the sports science category, I might later on change to n-fold cross validation with n around 10. The graphical result of applying the modified script can be seen here: 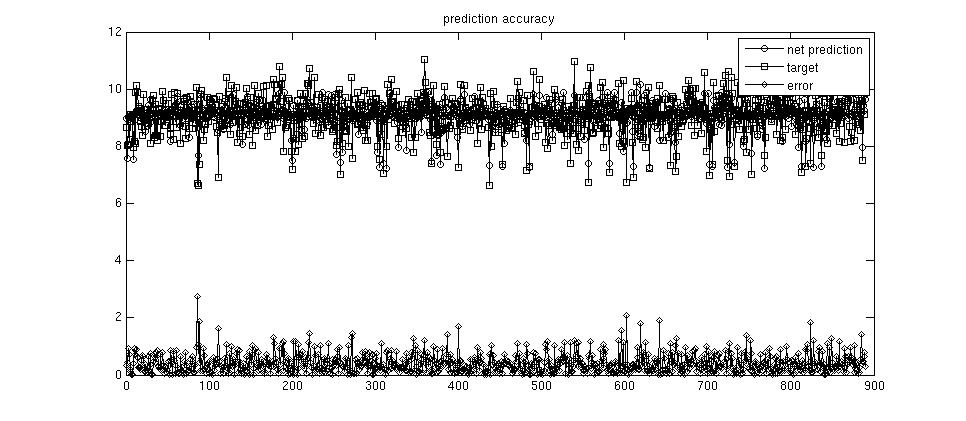
The results from the trained networks (predicted yield) and the actual result are on top of the graphics and the absolute error is at the bottom. Seems there’s still some way to go, with closer examination of the data and tuning the networks‘ parameters. But I do have the feeling that the modeling might work that way.