Georg Ruß' PhD Blog — R, clustering, regression, all on spatial data, hence it's:

November 30th, 2007

Still busy preparing a paper on „Wheat Yield Prediction using Neural Networks“

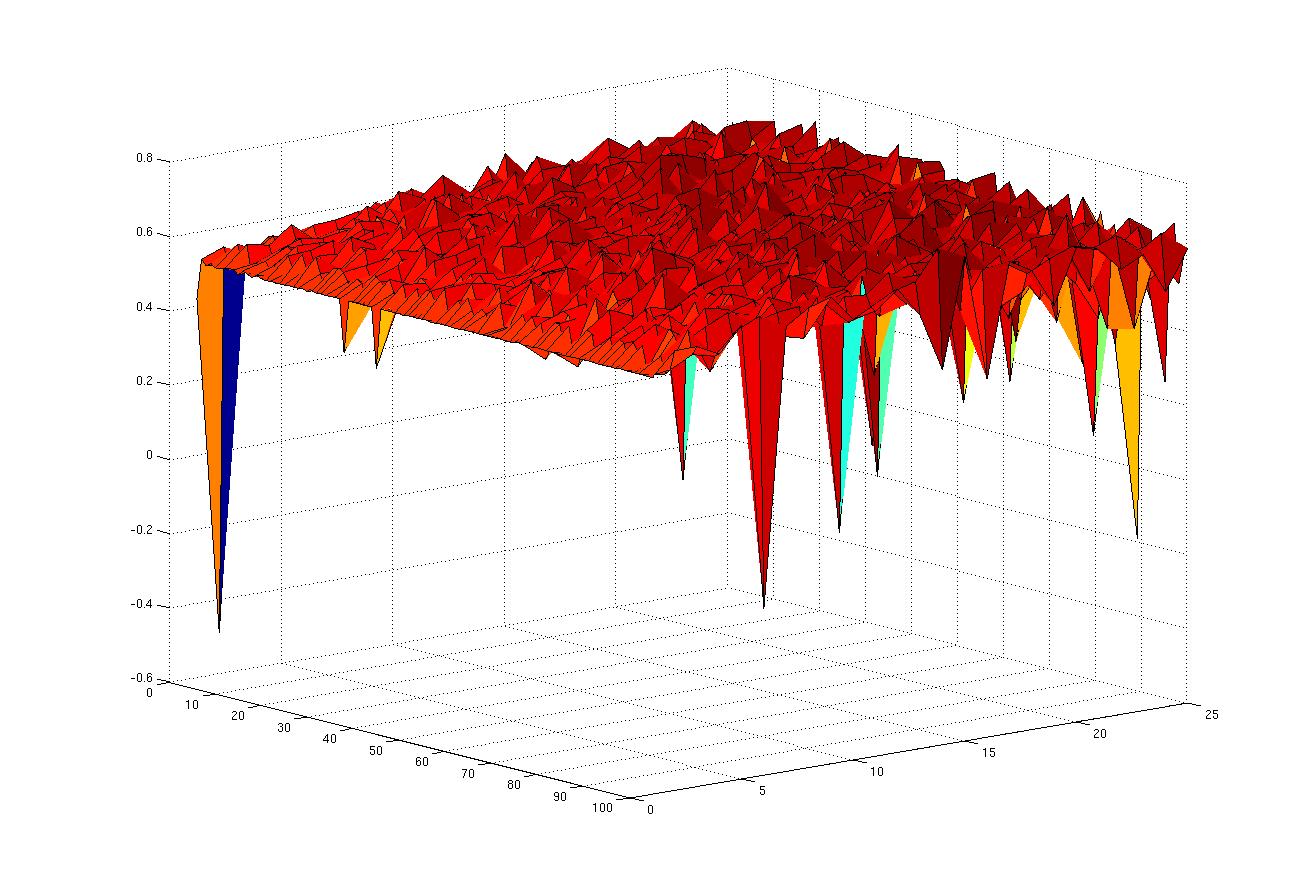
As I mentioned earlier, I’m still busy writing a paper on the agriculture data. Essentially, I’ve taken the wheat yield data, put a thorough description into the paper and have done some mining. This consisted of optimizing a neural network learned from the data or at least finding the optimal network topology to suit the data. The work was really interesting, given all the matlab scripting and evaluation of the network’s output. Actually, I’m lucky to have been provided with the data on this interesting problem.

Main outcome is that the wheat yield data (see details) can be modeled sufficiently well using neural networks with two hidden layers of 16 neurons each. It could also be seen experimentally that the size of the first hidden layer should be larger than or equal to the second hidden layer’s size. Something else that had been expected is that, as more data get available at the different times of fertilization, the approximation of the network gets better and hence the prediction gets better as well. The mse (mean squared error) sank from 0.3 to 0.2 t/ha where the mean yield was around 9 t/ha.

The preliminary abstract of the paper „Wheat yield prediction using Neural Networks“:

Precision agriculture (PA) and information technology (IT) are closely
interwoven. The former usually refers to the application of nowadays‘
technology to agriculture. Due to the use of sensors and GPS technology, in
today’s agriculture many data are collected. Making use of those data via IT
often leads to dramatic improvements in efficiency. This paper deals with
suitable modeling techniques for those agricultural data. In consequence, yield
prediction is enabled based on cheaply available site data. Based on this
prediction, economic or environmental optimization of, e.g., fertilization can
be carried out.

The corresponding matlab 2007b script can be downloaded here: agricult_10.m.

November 15th, 2007

Preparing a paper, teaching

As I said, I’m currently teaching exercises for „Intelligent Systems“. I’m also using Matlab there, so it might be of interest to see the very basic learning process of a threshold element for the logical NOT function. The script plots the error surface depending on weight and threshold. On top of this surface (mesh) it plots the outcome of the online-learning process using the delta rule. The script’s comments are in German; weight, threshold and learning rate can be adjusted. Some of the plots:
ISE0708-13a.jpgISE0708-13b.jpgISE0708-13c.jpg

and the Matlab script.

In addition to this, I’m currently preparing a paper on modeling the agriculture data using neural networks.

November 8th, 2007

New neural network toolbox in Matlab 2007b

There’s quite a lot of changes from the 2006a release to the 2007b release of Matlab. When reading the Neural Networks Toolbox‘ manual I discovered some of the useful functions for data splitting. So, here’s a basic script that reads data from a file, takes out some of the columns and prepares the rest for a neural network. There’s no need to mapminmax or mapstd the data explicitly before and after the neural network as it does those things automagically. Overall, the script has just 16 lines of code (plus an external script), which includes setting network parameters. That’s really neat; Matlab definitely encourages rapid prototyping. The script can be found here: nnet_basic.m.

November 2nd, 2007

Regression analysis with postreg and 3D-plots

There’s ever more Matlab functions to be discovered, as I mentioned lately. I took the time and finished reading the „Neural Network Toolbox 5 User’s Guide“. At the moment I can’t use most of the divide* functions as I’m using an older Matlab release. Something that works is postreg which can be used to perform a regression analysis between the network response and the corresponding targets. Since I assume that it might be useful to study the impact of two network parameters on the model, I decided to vary the learning rate and the hidden layer size of the neural network. This makes for nice 3D plots:
agri08_postreg_train.jpgagri08_postreg_test.jpgagri08_postreg_train_test.jpg
Both show the value of the correlation coefficient between the simulated output and the actual target. The first one does this for the training set, whereas the second one does this for the validation data (that was not included in training). The third plot combines both, although it’s hard to find an appropriate viewing angle. The hidden layer size was varied from 1 to 25, and the min_grad parameter was varied from 0.1/1 to 0.1/100 (hence the 1-100 scale).

The network works as expected:

  • with more available weights (growing hidden layer), the approximation gets better
  • with a smaller gradient (i.e. longer learning time) the approximation gets better

The script can be found here: agricult_08.m.

November 2nd, 2007

Normalization in the context of sports science data

At the moment I’m somewhat split between teaching „Intelligent Systems“ courses and thinking about the agriculture data as well as the sports science data. In yesterday’s meeting, we discussed the three data blocks that are available from them. I’ll receive the purged data soon. One thing that was mentioned was the issue of normalization. Read the rest of this entry »

Oktober 30th, 2007

Highly recommended: Matlab’s nnet manual

Diving deeper into Matlab’s endless built-in functions, I discovered (i.e. read) Mathworks‘ nnet manual. I usually abhor user manuals for specific programming languages, but Mathworks has made it an enjoyable read.
Read the rest of this entry »

Oktober 26th, 2007

Cross validation — how to determine fold size

When applying cross validation, it is necessary to determine an appropriate size for folds of data to split the data set accordingly. An empirical way to do this is to try different fold sizes and check when the error reaches a minimum (or some other criterion). This is what the latest matlab script does.
Read the rest of this entry »

Oktober 23rd, 2007

Underestimating Matlab’s built-in functions

To clean up the main code of the cross-validation script, I decided to source out the part that deals with splitting the data into training and testing sets. After I had created and verified the code, I discovered Matlab’s built-in dividevec function from the Neural Network Toolbox. It does something similar and was introduced from R2006A:

The dividevec function facilitates dividing your data into three distinct sets to be used for training, cross validation, and testing, respectively. Previously, you had to split the data manually.

Read the rest of this entry »

Oktober 18th, 2007

Using Matlab’s rand() function to determine network parameters

In the recent scripts I used Matlab’s rand() function to seed the random number generator. I aimed at generating reproducible results. However, if the data can be modeled with an MLP, then it should most of the time converge towards the same solution, given that the initialization is not too different (weights from -1 to 1).
Read the rest of this entry »

Oktober 17th, 2007

Experiments with the agriculture data (II)

Yesterday’s entry featured a short cross validation, using a fixed network structure. This structure should be verified and improved.
Read the rest of this entry »