Georg Ruß' PhD Blog — R, clustering, regression, all on spatial data, hence it's:

Januar 26th, 2009

A comparison of regression models — ICDM 2009 conference

I’ve just finished writing a paper which deals with the data sets I have for agricultural yield prediction. This will be handed in at the ICDM 2009 in Leipzig.

The abstract of the paper:
Nowadays, precision agriculture refers to the application of state-of-the-art GPS technology in connection with small-scale, sensor-based treatment of the crop. This introduces large amounts of data which are collected and stored for later usage. Making appropriate use of these data often leads to considerable gains in efficiency and therefore economic advantages. However, the amount of data poses a data mining problem — which should be solved using data mining techniques. One of the tasks that remains to be solved is yield prediction based on available data. From a data mining perspective, this can be formulated and treated as a multi-dimensional regression task. This paper deals with appropriate regression techniques and evaluates four different techniques on selected agriculture data. A recommendation for a certain technique is provided.
Read the rest of this entry »

Januar 12th, 2009

Extended Deadlines MLDM/ICDM

The deadlines for ICDM 2009 and MLDM 2009 have been mysteriously extended such that they coincide with the written examination for the course on Intelligent Systems, which I’m teaching this term. Nevertheless, the MLDM paper is almost finished whereas most of the work for the ICDM 2009 paper has been done, but has to be documented and ‚paperized‘ appropriately.

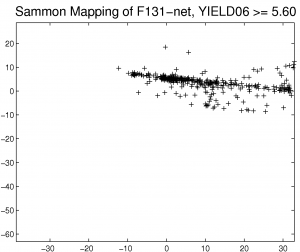
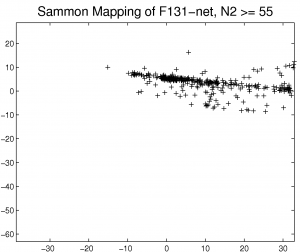
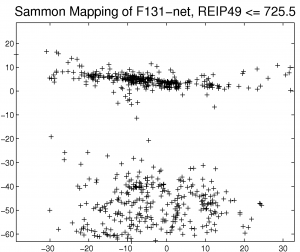
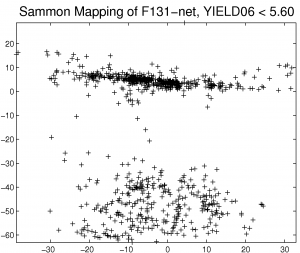
For the MLDM work, which is about applying Sammon’s mapping and Self-Organizing Maps to the agriculture data, there were some changes. For example, one of the data sets contains data for different fertilization strategies. This data set can also be split into two sub-data sets, one for each strategy, for in-depth analysis. One of the strategies was to use a neural network for yield prediction — and it has been unclear what kind of connections the NN has learnt so far. The idea is to visualize the data that the NN has used for training and prediction. So, projecting those data onto a mapping could yield interesting results as to the internal workings of the NN. This is more or less what the paper is about. Useful, interesting, and encouraging.

Without further commenting, here are some graphs:

I do see correlations. What about you?

|