I’ve returned from the Specialist’s Group on Artificial Intelligence of the British Computer Society’s meeting at Peterhouse College, Cambridge, UK. The event was quite worthwile, where undoubtedly the best speaker was Max Bramer himself. On Monday he gave a talk to PhD students on „How to survive a viva“. Since he often has been and will be an external supervisor or reviewer of PhD students‘ theses, he told us what he thinks is important in the thesis, how to write it, what and what not to do and so on. His talk was riddled with hilarious real examples of what he saw in thesis drafts or even final theses. That event, even featured as a free event to PhD students, was actually included for the first time at the conference before the main conference began on Tuesday.
Read the rest of this entry »
Seiten
Kategorien
- agriculture
- conferences
- data mining
- Deutsch
- English
- Environmental Data Mining
- go8-coop
- ICDM 2008
- ICDM 2009
- ICDM 2010
- ICDM 2011
- ICPA 2010
- IDA 2009
- IDA 2010
- IEEE-ICDM10
- IFCS 2009
- IFIP AI-2008
- IPMU 2008
- IPMU 2010
- MLDM 2009
- neuroscience
- personal
- R
- SGAI AI-2007
- SGAI AI-2008
- SGAI AI-2009
- sports science
- Uncategorized
Our recent book
 Data Mining et al — RSS feed
Meta
Back from SGAI2007
SGAI 2007
I’ll be presenting a paper about my master’s thesis‘ work at the SGAI 2007 International Conference on Artificial Intelligence. See the technical stream of the conference for my talk about Relevance Feedback for Association Rules by Leveraging Concepts from Information Retrieval. The slides are available here: presentation slides for AI-2007.
Overfitting vs. Cross-Validation
One more experiment with the sports science data clearly shows the issue of overfitting of the neural network. I devised a script that automatically generates networks with two hidden layers of neurons and varies the layers‘ sizes from 2 to 16 systematically, respectively. No matter how the parameters for the learning process were set, the mean squared error plotted against the two layer sizes (right: first hidden layer, left: second hidden layer) is zero as soon as the networks get larger:

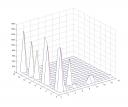
However, when applying cross-validation (test set: 1 record, validation set: 1 record, training set: 38 records), the error, especially towards the larger layer sizes, rises. This is a clear sign of overfitting (scales as in the last figure):

As usual, the matlab script for this entry, which doesn’t differ much from the latest ones: neuro10-new_plot.m.
Data Mining et al is powered by WordPress | Using Tiga theme with a bit of Ozh + WP 2.2 / 2.3 Tiga Upgrade
