Georg Ruß' PhD Blog — R, clustering, regression, all on spatial data, hence it's:

Januar 8th, 2008

The „squared“ in „mean squared error“

The latest experiments with the sports science data always turned out outrageously high errors which most of the time missed the scale of the original attribute by orders of magnitude. After conducting some experiments which returned negative conclusions like:

  • the error is too high, therefore the network cannot be trained on these data or
  • there is some tendency to overfitting when the network size and the learning rate increase, but the error is way too large anyway,

I presented the examples to the sports science people which were also quite surprised about the error’s order of magnitude. When returning back to my office, I had the sudden idea what I had actually shown in the graphs — after taking the sqrt of the mse I ended up with what I had actually wanted to show in the plots: the absolute error, i.e. the absolute of the difference between the predicted result from the network and the actual result. It’s somewhat embarrassing, anyway, but at least I know the cause of the high-error issue.

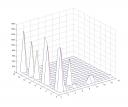
For the plot below I also got some advice from the sports science people to take out some redundant data (four columns out of 24 are more or less sums of three others each). Now the error is in a region that is more reasonable when a min/max of 841/1004 are expected for the target attribute. The plot shows error vs. the size of the first and second hidden layer of the feed-forward network, respectively.
neuro12, absolute error instead of mse

Dezember 18th, 2007

Back from SGAI2007

I’ve returned from the Specialist’s Group on Artificial Intelligence of the British Computer Society’s meeting at Peterhouse College, Cambridge, UK. The event was quite worthwile, where undoubtedly the best speaker was Max Bramer himself. On Monday he gave a talk to PhD students on „How to survive a viva“. Since he often has been and will be an external supervisor or reviewer of PhD students‘ theses, he told us what he thinks is important in the thesis, how to write it, what and what not to do and so on. His talk was riddled with hilarious real examples of what he saw in thesis drafts or even final theses. That event, even featured as a free event to PhD students, was actually included for the first time at the conference before the main conference began on Tuesday.
Read the rest of this entry »

Dezember 7th, 2007

SGAI 2007

I’ll be presenting a paper about my master’s thesis‘ work at the SGAI 2007 International Conference on Artificial Intelligence. See the technical stream of the conference for my talk about Relevance Feedback for Association Rules by Leveraging Concepts from Information Retrieval. The slides are available here: presentation slides for AI-2007.

Dezember 4th, 2007

Overfitting vs. Cross-Validation

One more experiment with the sports science data clearly shows the issue of overfitting of the neural network. I devised a script that automatically generates networks with two hidden layers of neurons and varies the layers‘ sizes from 2 to 16 systematically, respectively. No matter how the parameters for the learning process were set, the mean squared error plotted against the two layer sizes (right: first hidden layer, left: second hidden layer) is zero as soon as the networks get larger:
Without cross validation, the error is zero with larger networks

However, when applying cross-validation (test set: 1 record, validation set: 1 record, training set: 38 records), the error, especially towards the larger layer sizes, rises. This is a clear sign of overfitting (scales as in the last figure):
With cross validation, one can see the effects of overfitting quite clearly

As usual, the matlab script for this entry, which doesn’t differ much from the latest ones: neuro10-new_plot.m.

November 30th, 2007

Still busy preparing a paper on „Wheat Yield Prediction using Neural Networks“

As I mentioned earlier, I’m still busy writing a paper on the agriculture data. Essentially, I’ve taken the wheat yield data, put a thorough description into the paper and have done some mining. This consisted of optimizing a neural network learned from the data or at least finding the optimal network topology to suit the data. The work was really interesting, given all the matlab scripting and evaluation of the network’s output. Actually, I’m lucky to have been provided with the data on this interesting problem.

Main outcome is that the wheat yield data (see details) can be modeled sufficiently well using neural networks with two hidden layers of 16 neurons each. It could also be seen experimentally that the size of the first hidden layer should be larger than or equal to the second hidden layer’s size. Something else that had been expected is that, as more data get available at the different times of fertilization, the approximation of the network gets better and hence the prediction gets better as well. The mse (mean squared error) sank from 0.3 to 0.2 t/ha where the mean yield was around 9 t/ha.

The preliminary abstract of the paper „Wheat yield prediction using Neural Networks“:

Precision agriculture (PA) and information technology (IT) are closely
interwoven. The former usually refers to the application of nowadays‘
technology to agriculture. Due to the use of sensors and GPS technology, in
today’s agriculture many data are collected. Making use of those data via IT
often leads to dramatic improvements in efficiency. This paper deals with
suitable modeling techniques for those agricultural data. In consequence, yield
prediction is enabled based on cheaply available site data. Based on this
prediction, economic or environmental optimization of, e.g., fertilization can
be carried out.

The corresponding matlab 2007b script can be downloaded here: agricult_10.m.

November 26th, 2007

Granted project proposal

There was a deadline at the end of August 2007 for a joint Australian-German research cooperation between the DAAD and the Go8, where the latter is a cooperation between eight of the largest (best?) universities of Australia. We came, we saw, we conquered — there were 26 successful applications for a funded cooperation between a German university or research team and a corresponding Australian part. Further details can be found at the Go8’s website and the rest of the successful applications can be found here (pdf-file). Our topic was related to the optimization of wind turbines to ensure security of supply.

November 15th, 2007

Preparing a paper, teaching

As I said, I’m currently teaching exercises for „Intelligent Systems“. I’m also using Matlab there, so it might be of interest to see the very basic learning process of a threshold element for the logical NOT function. The script plots the error surface depending on weight and threshold. On top of this surface (mesh) it plots the outcome of the online-learning process using the delta rule. The script’s comments are in German; weight, threshold and learning rate can be adjusted. Some of the plots:
ISE0708-13a.jpgISE0708-13b.jpgISE0708-13c.jpg

and the Matlab script.

In addition to this, I’m currently preparing a paper on modeling the agriculture data using neural networks.

November 8th, 2007

New neural network toolbox in Matlab 2007b

There’s quite a lot of changes from the 2006a release to the 2007b release of Matlab. When reading the Neural Networks Toolbox‘ manual I discovered some of the useful functions for data splitting. So, here’s a basic script that reads data from a file, takes out some of the columns and prepares the rest for a neural network. There’s no need to mapminmax or mapstd the data explicitly before and after the neural network as it does those things automagically. Overall, the script has just 16 lines of code (plus an external script), which includes setting network parameters. That’s really neat; Matlab definitely encourages rapid prototyping. The script can be found here: nnet_basic.m.

November 2nd, 2007

Regression analysis with postreg and 3D-plots

There’s ever more Matlab functions to be discovered, as I mentioned lately. I took the time and finished reading the „Neural Network Toolbox 5 User’s Guide“. At the moment I can’t use most of the divide* functions as I’m using an older Matlab release. Something that works is postreg which can be used to perform a regression analysis between the network response and the corresponding targets. Since I assume that it might be useful to study the impact of two network parameters on the model, I decided to vary the learning rate and the hidden layer size of the neural network. This makes for nice 3D plots:
agri08_postreg_train.jpgagri08_postreg_test.jpgagri08_postreg_train_test.jpg
Both show the value of the correlation coefficient between the simulated output and the actual target. The first one does this for the training set, whereas the second one does this for the validation data (that was not included in training). The third plot combines both, although it’s hard to find an appropriate viewing angle. The hidden layer size was varied from 1 to 25, and the min_grad parameter was varied from 0.1/1 to 0.1/100 (hence the 1-100 scale).

The network works as expected:

  • with more available weights (growing hidden layer), the approximation gets better
  • with a smaller gradient (i.e. longer learning time) the approximation gets better

The script can be found here: agricult_08.m.

November 2nd, 2007

Normalization in the context of sports science data

At the moment I’m somewhat split between teaching „Intelligent Systems“ courses and thinking about the agriculture data as well as the sports science data. In yesterday’s meeting, we discussed the three data blocks that are available from them. I’ll receive the purged data soon. One thing that was mentioned was the issue of normalization. Read the rest of this entry »